PI5RTA at terAA - Helmond
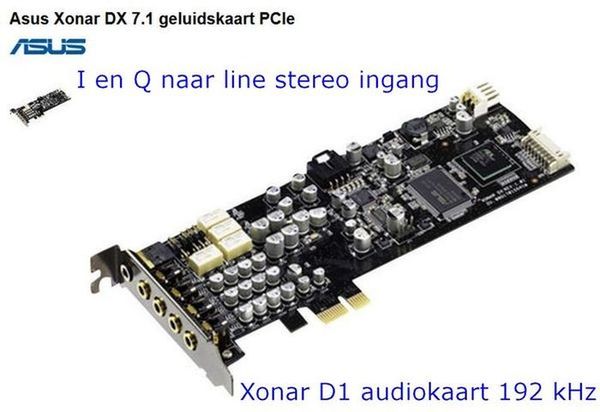
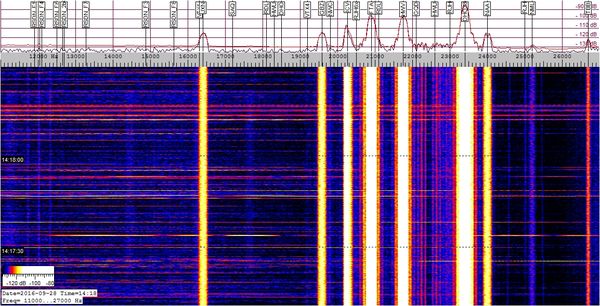
With our present equipment we are able to receive the radio spectrum from 0 to 96 kHz. Using an audio transformer the antenna signal is fed directly into the audio input of a soundcard. With a sample rate of 192 kHz the result of a Fast Fourier Transform using the program Spectrum Lab can be shown as a spectrum from 0 to 96 kHz in two different ways. On top of the first graph you find the Fourier spectrum showing the signal strength as a function of time in two colours. The black line shows the actual Fourier result while the red line shows the average result over the last 5 minutes.
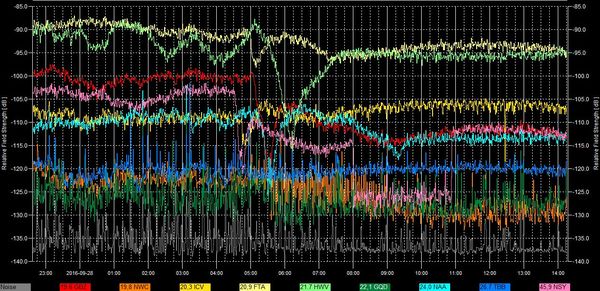
The right part shows the same actual spectrum but now as a function of time. Different colours in this waterfall display represent the signal strength. In the second graph you find the signal strengths of a number of stations on discrete frequencies as a function of time. The contents of this second graph slowly moves to the left. In total you can see the signal strength over a period of 12 hours.In this second graph it is possible to recognise a number of physical phenomena.First of all you see the influence of the Sun on the propagation at sunrise and sunset in the direction of the transmitter. The signal strength is very different if you compare the signals during daytime and nighttime. At daytime the signals are usually rather constant compared to nighttime. At daytime the signals are refracted by the D-layer. The influence of the Sun is zero at night over the path towards the transmitter. The signals are then refracted by the E-layer.At daytime there may be some sudden variations on the signals. If you see a temporary variation on multiple transmitters' signals at the same time it may be the result of a solar flare influencing the propagation path between transmitter and receiver. This is called a Sudden Ionospheric Disturbance (SID). The occurence of solar flares can be monitored in real time on this Any X-ray event during daytime of at least C2 level may produce a SID registration on our graphs. An overview of the VLF stations that may be received at our station PI5FTS at Fontys University in Eindhoven can be found on the.
Explanation of: VLF radio propagation
Spectrum Lab , Audio Spectrum Analyzer
SAQ VLF Panoramic receiver
VLF radio propagation
Spectrum Lab , Audio Spectrum Analyzer
SAQ VLF Panoramic receiver
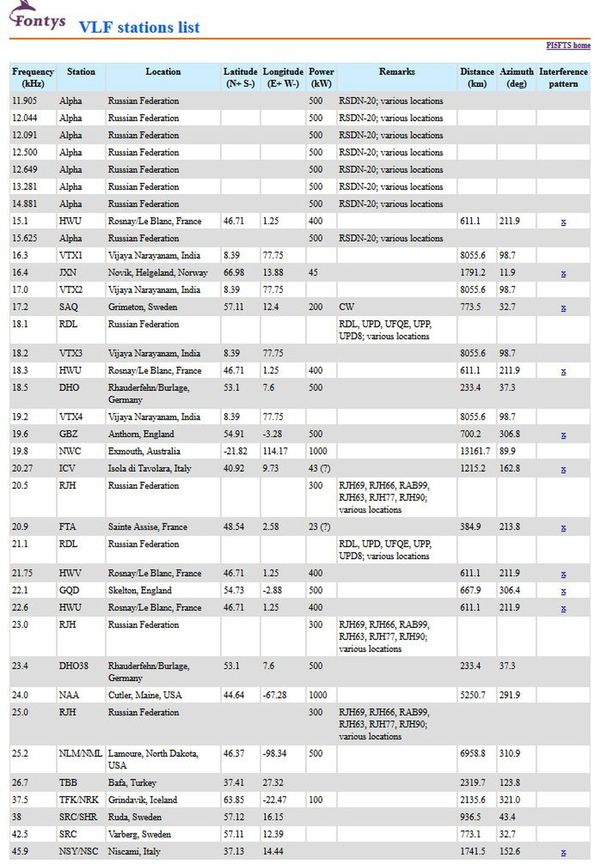
 VLF station list